Litecoin now stands at 21st rank in terms of market capitalization with combined liquidity of 83% of its total supply of LTC tokens. After Bitcoin, Litecoin has the largest merchant network in the world, and its growth could bring the value of LTC to match its previous highs. The only hindrance in this vision is consistent growth and projection of new cryptocurrencies that could suppress the possibilities of Litecoin. Its last released test net focused on improving the privacy and fungibility of the LTC transaction ecosystem.
Litecoin Price Analysis
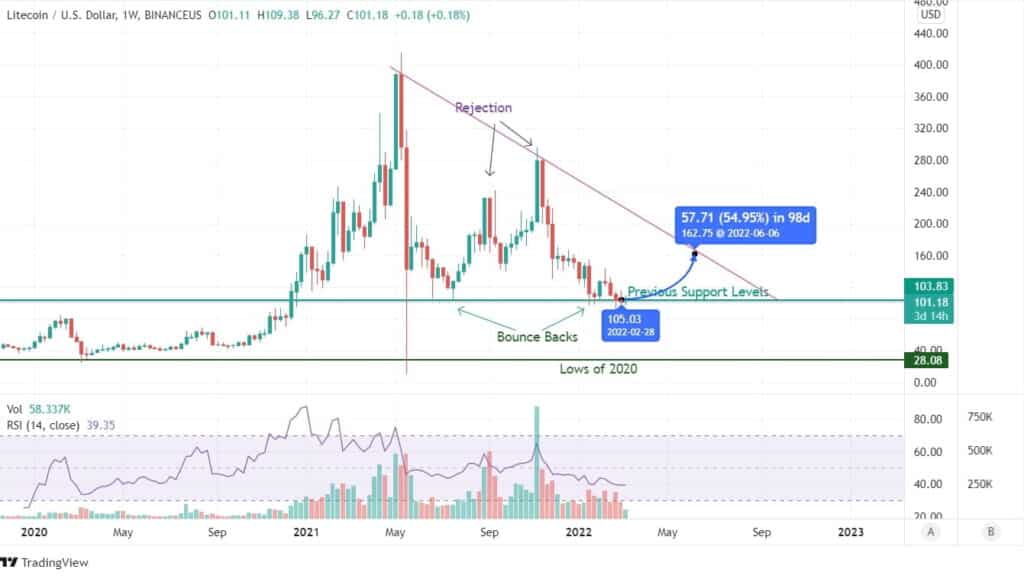
Price movement on digital assets is more concerned with historical trends and support levels rather than its actual success. While Litecoin surprised us all with its exceptional growth trajectory marking gains of over 1000% since 2020 lows of $28. Current LTC price action is not only testing the buyer’s patience at lower price levels but facing rejection on every weekly gain.

Weekly candlestick charts indicate a concise price movement as a trend. Litecoin has been moving south ever since it made an all-time high in May of 2021. Despite numerous attempts to recapture its previous market value, LTC has not exactly been able to overcome the profit booking sentiment. Another significant price trend noticeable from the charts is the profit booking sentiment just after a booming weekly up move. It seems like LTC holders are in some sort of hurry to liquidate their investment and make profits.
The rejections from the September peak and November peak just confirms a profit booking sentiment at LTC counters. Moreover, prices falling under $100 could bring more negativity as LTC has already breached the historical support level that it has defended since the May 2021 crypto crash. If we look at the RSI pattern, despite its increase in liquidity which stands at 83% of its total supply, LTC has shown a noticeable decline in buying trend since last year. Any bounce back from these levels should at least test the trendline. In our estimate, LTC should at least retest $160 levels in case the buying trend revives in the coming four to five months. Hence the risk to reward ratio carries a 60% gain to 80% loss scenario. Combining the possibility of the previous bounceback from similar levels, we can expect LTC to move ahead in terms of price action. Traders or investors can do their research or explore experts’ projections to find more details about the coin’s future.

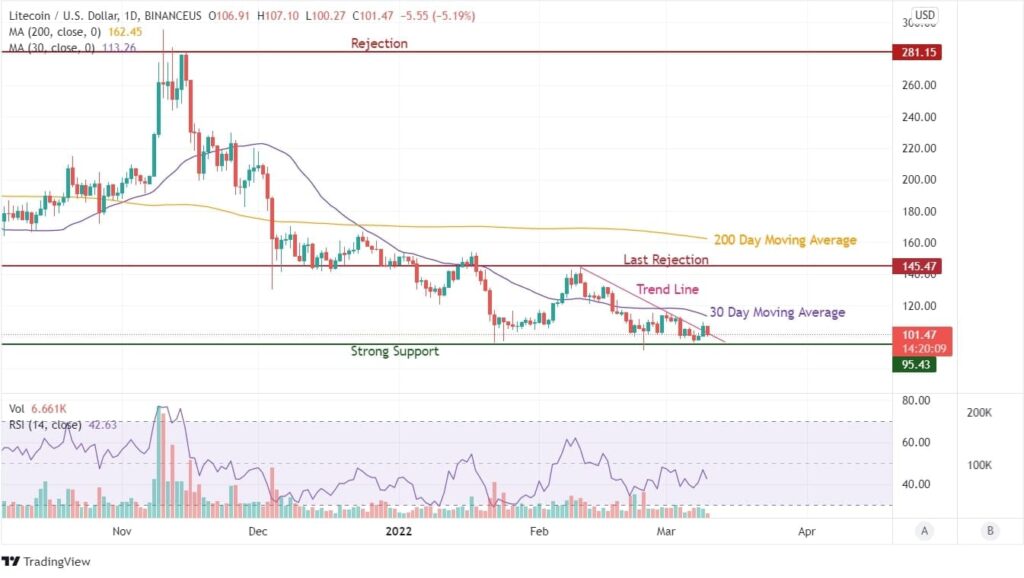
On the daily charts, the price trend seems like buyers are taking advantage of the dip, but sellers going aggressive and booking profits. There have been several instances of LTC breaching its negative trendline, but just as buyers expect prices to breach the recently rejected levels, a massive profit booking sweeps the sentiment. RSI can be seen struggling in the neutral levels. Currently, its 200 DMA lies at $150 levels while 30 DMA lies around $115. Ideally, trading between these two levels would have projected a strong retracement potential. However, a bounce back from lower levels and upside-moving DMA curves could further improve the sentiment across LTC in the short term.


