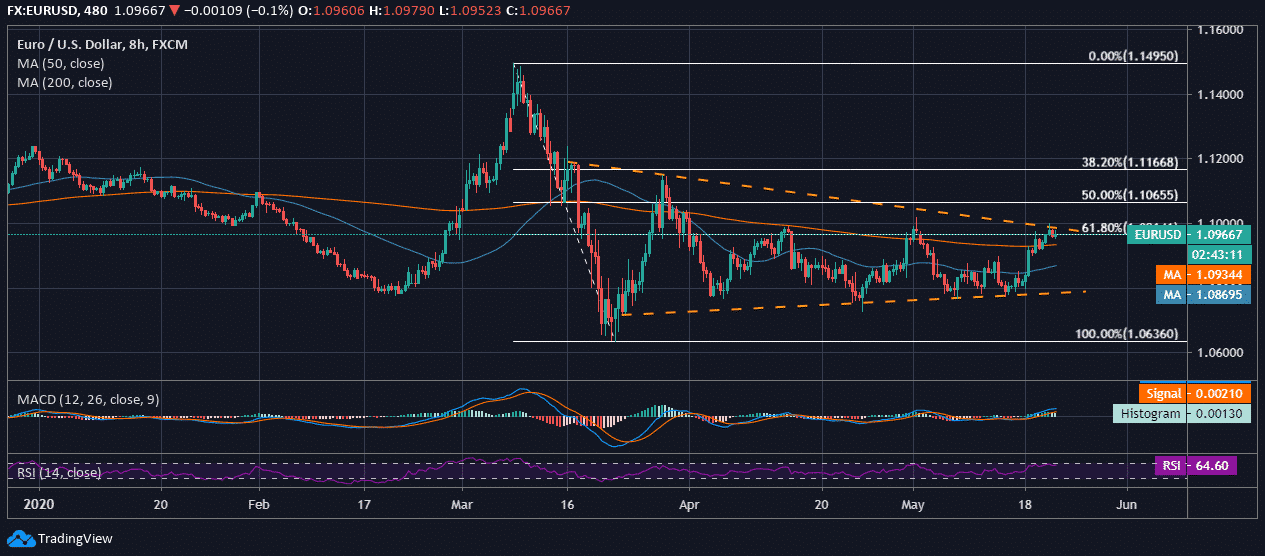
EUR/USD is trading at 1.096 in the global market, and a candlewick slightly hits above 61.80% Fib Retracement level. Over the past 8 weeks, the trend of the pair is hitting consecutive lower highs on the 4-hourly chart. The intraday appears moderately volatile and is drawing a bullish crossover at the press time. In the intraday, Euro is facing strong resistance at 1.099 and 1.10 over the past month due to a lack of steady momentum against the greenback.
Technical Analysis: EUR/USD
On the 4-hourly chart, the price of the Euro is declining in a narrow trading range against the US Dollar. The intraday appears to be a gainer as the price rose above 1.08 and thereby retained support from 50-day and 200-day MA.
With the ease in the restriction of the lockdown, we will see the strengthening of the Euro against the US Dollar. A close above 200-day MA should remain intact and should move above 61.80% Fib Retracement level in order to come out of the narrow trading range.
On the downside, 1.095 and 1.090 are the major support area for the pair, and the major resistance lies at 1.099 and 1.10. The technicals appear bullish, as the MACD line has crossed above the signal line due to intraday price rise. The RSI of EUR/USD is at 64.60 and hitting around the overbought zone due to its increasing demand.


