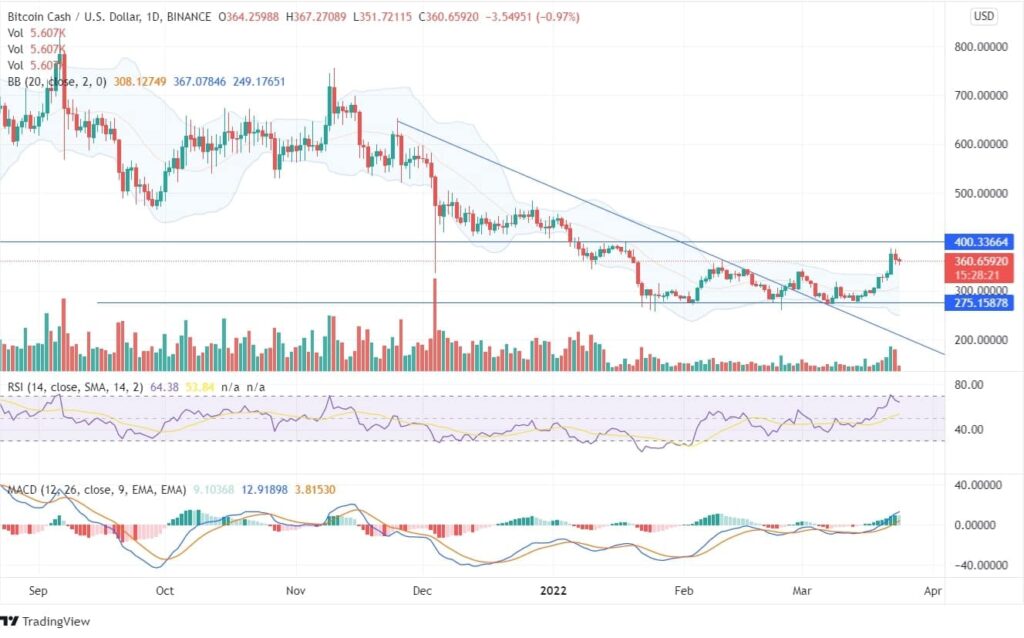
The price of Bitcoin Cash surges from its lows after a constant downfall of price from the last four months. The coin has been profitable for the bulls during the last week as the price showed a hike of 37%. BCH moving sideways in between the channel shows the price movement of 45% between the horizontal lines. The Bollinger bands showing the volatility of the daily price movement becomes wider, thus indicating a robust price action.

The price closing above the upper band may be an opportunity for the bulls resulting in an uptrend market. Though the coin showed an upliftment from the support line of $125, however, the price couldn’t close above the high of $400. The current price movement shows the candle turning around from the swing high of $386, followed by the formation of bearish candles. The price may lead back towards the bottom horizontal line of $275.
The MACD indicator shows the MACD line above the signal line with the green candles that indicates bullish momentum. The RSI being 63 currently shows the price declining after reaching its overbought zone. The BCH coin price showed a decline of 8% yesterday. As of now, most of the investors and traders have one question in mind: is it the best time to invest in BCH? Check out the experts’ opinions and future price projections.
Bitcoin Cash may reach its highs as on the weekly chart it is expanding from the same zone as from where it has risen during the past. Once the price breaks the peak of $400, a strong bullish momentum can be expected in the long run.


