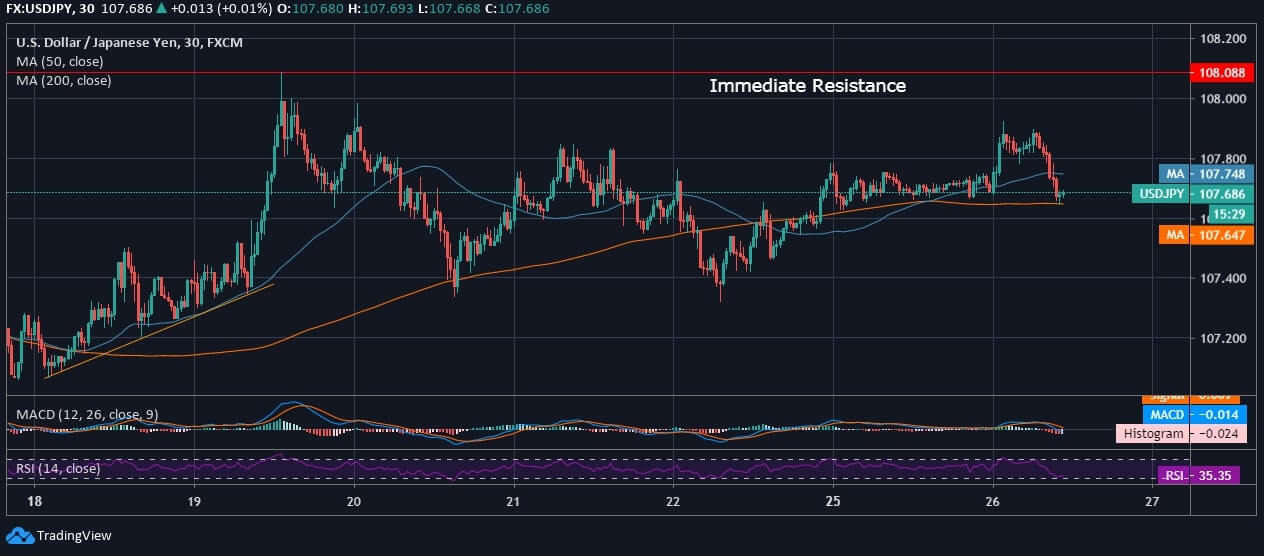
USD/JPY appears drawing a bullish crossover for the second day straight and currently trades at 107.686 and retains 200-day MA support. After hitting the higher high at 107.9 in the early trading hours, today, the pair lacked the traction and dipped to the current trading level, eventually losing support from 50-day MA at 107.7.
Alongside this, there is major weekly resistance at 108.088, after which the US Dollar lacked the traction and hit the midweek lowest at 107.3.
However, the steep intraday fall points at the growing volatility of demand of the US Dollar, and it again plummeted to retest yesterday’s support. The week initially started with a subtle uptrend, and the USD/JPY is moderately volatile in itself. After a dull sentiment at the onset of the week, the pair gradually took off, and the US Dollar is seen strengthening as the economies get back to working amidst the Pandemic after a long lockdown.
The Asian market has been trading in the green today, and we have seen many currencies wherein the majors viz., Euro, and Pound have also drawn a bullish crossover against the greenback.
The intraday has been quite a gainer over the past 4 days until today when USD/JPY slid to retest daily supports. The major and strong support lies at 107.3 in the intraday from where the pair took off for a modest rebound.
The technical indicators have turned bearish due to intraday correction, and the signal line crosses above the MACD line. At the same time, the RSI lies at 35.35 and is lingering around the oversold region. A further fall is likely to increase the selling pressure.


